

Monitor#
Overview#
The Monitor page provides a real-time view of the status of the motor and of the communication system, and records all the events and alarms generated during FlexiBowl® operation. It is the reference page for diagnostics and troubleshooting.
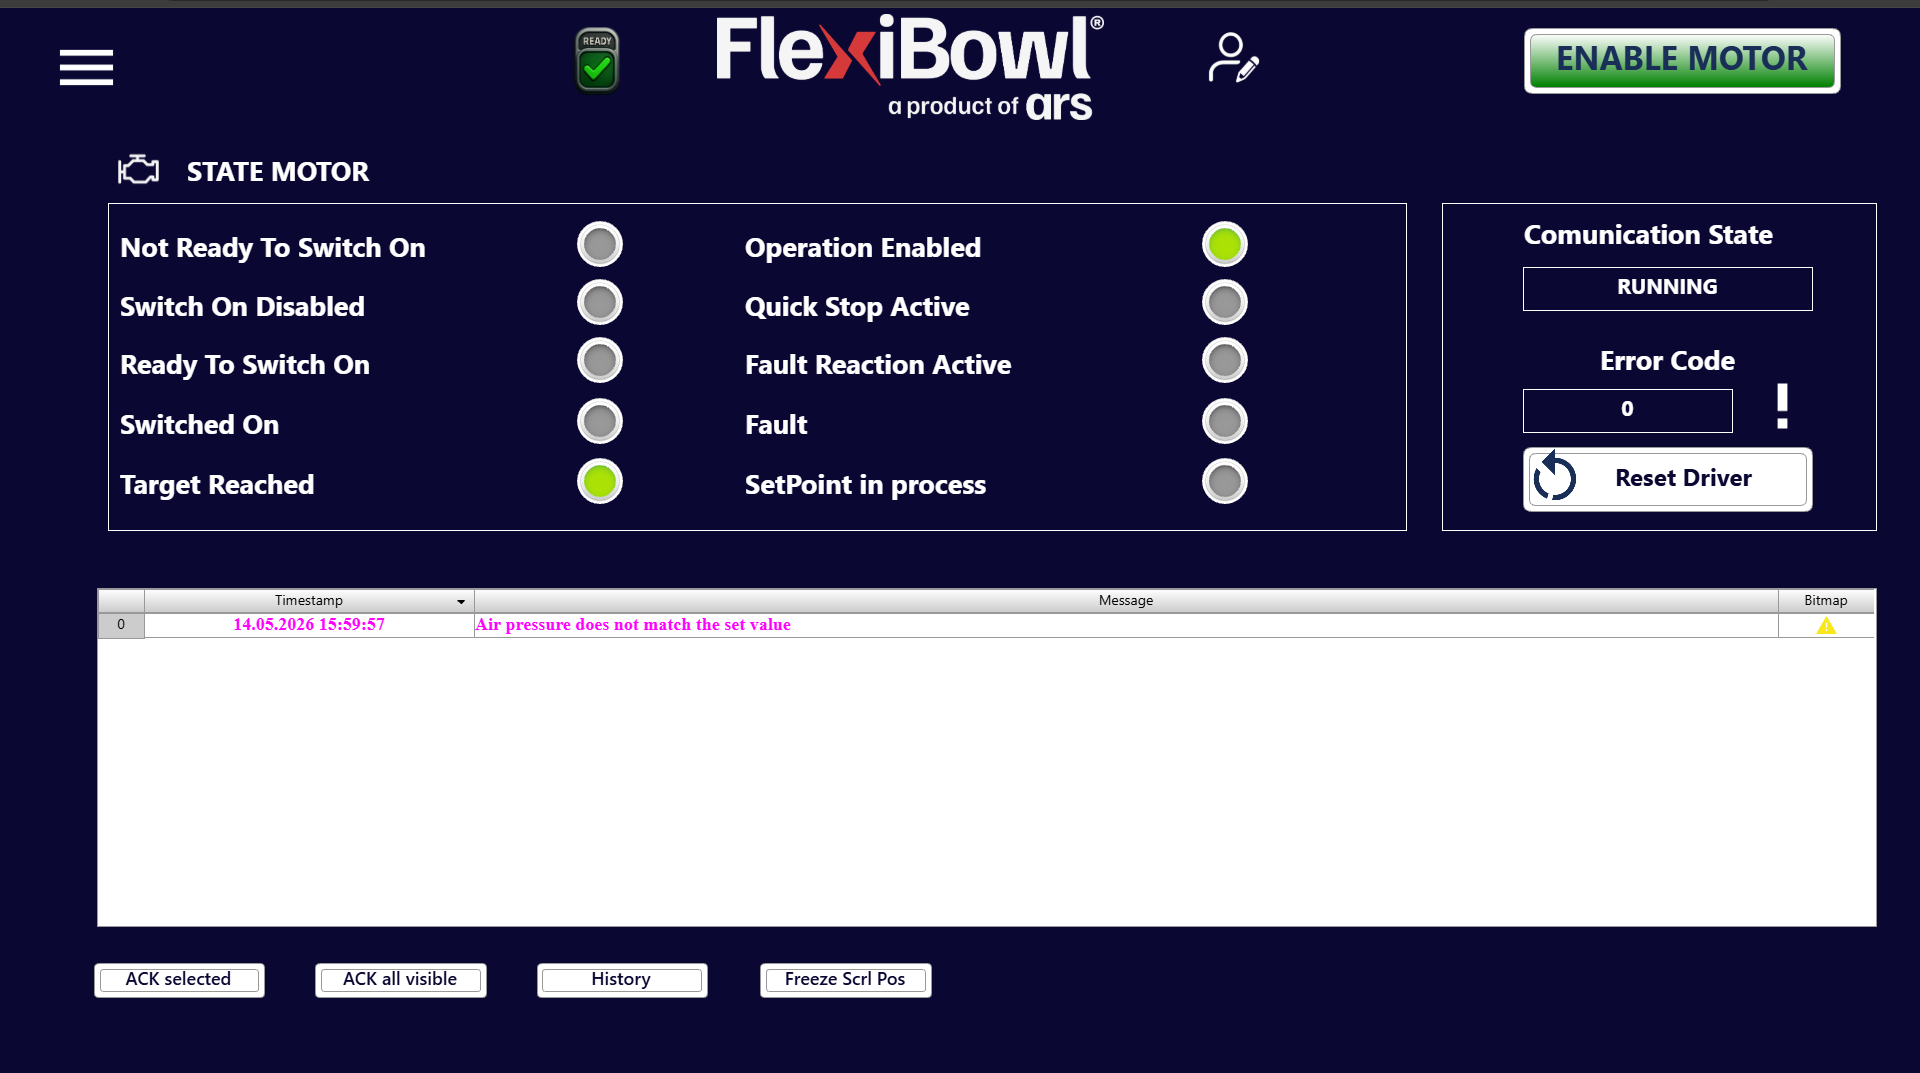
STATE MOTOR section#
The STATE MOTOR panel shows the current operating state of the motor driver by means of a series of indicator lights (virtual LEDs).
Each LED can be:
🟢 Green : active state
⚫ Grey : inactive state
Status indicators#
Indicator |
Description |
|---|---|
Not Ready To Switch On |
The driver is not ready to be enabled |
Switch On Disabled |
Motor enabling is blocked |
Ready To Switch On |
The driver is ready to receive the enable command |
Switched On |
The motor is powered but not yet under active control |
Target Reached |
The FlexiBowl® has reached the target position or setpoint |
Operation Enabled |
The motor is enabled and operational |
Quick Stop Active |
Quick stop of the motor requested |
Fault Reaction Active |
The driver is carrying out the fault reaction procedure |
Fault |
An active fault is present on the motor driver |
SetPoint in process |
The system is processing or reaching a new position setpoint |
Note
During normal operation, the Operation Enabled and Target Reached LEDs must be green. Any other green LED indicates an abnormal condition that requires attention.
Communication State section#
The right-hand side panel shows the status of the communication between the software and the motor driver.
Field |
Example value |
Description |
|---|---|---|
Communication State |
|
Indicates that communication with the driver is active and working |
Error Code |
|
Error code returned by the driver. The value |
Event log (message table)#
The central table records in real time all the events, alarms and system messages generated during operation.
Table columns#
Column |
Description |
|---|---|
Timestamp |
Date and time of the event in the format |
Message |
Text description of the event or alarm |
Bitmap |
Icon indicating the type of event (⚠️ warning, ❌ error, etc.) |
Example message#
# |
Timestamp |
Message |
Bitmap |
|---|---|---|---|
0 |
14.05.2026 15:59:57 |
Air pressure does not match the set value |
⚠️ |
Warning
The message “Air pressure does not match the set value” indicates that the air pressure detected by the system does not match the value set in the parameters. Check the pneumatic supply and check the Flip Pressure and Blow Pressure values on the Main Command > OPTION page.
Tip
Warning messages are displayed in red in the Timestamp column and in orange in the Message column, so that they can be recognized immediately even when the log contains many rows.