

Graphs#
Overview#
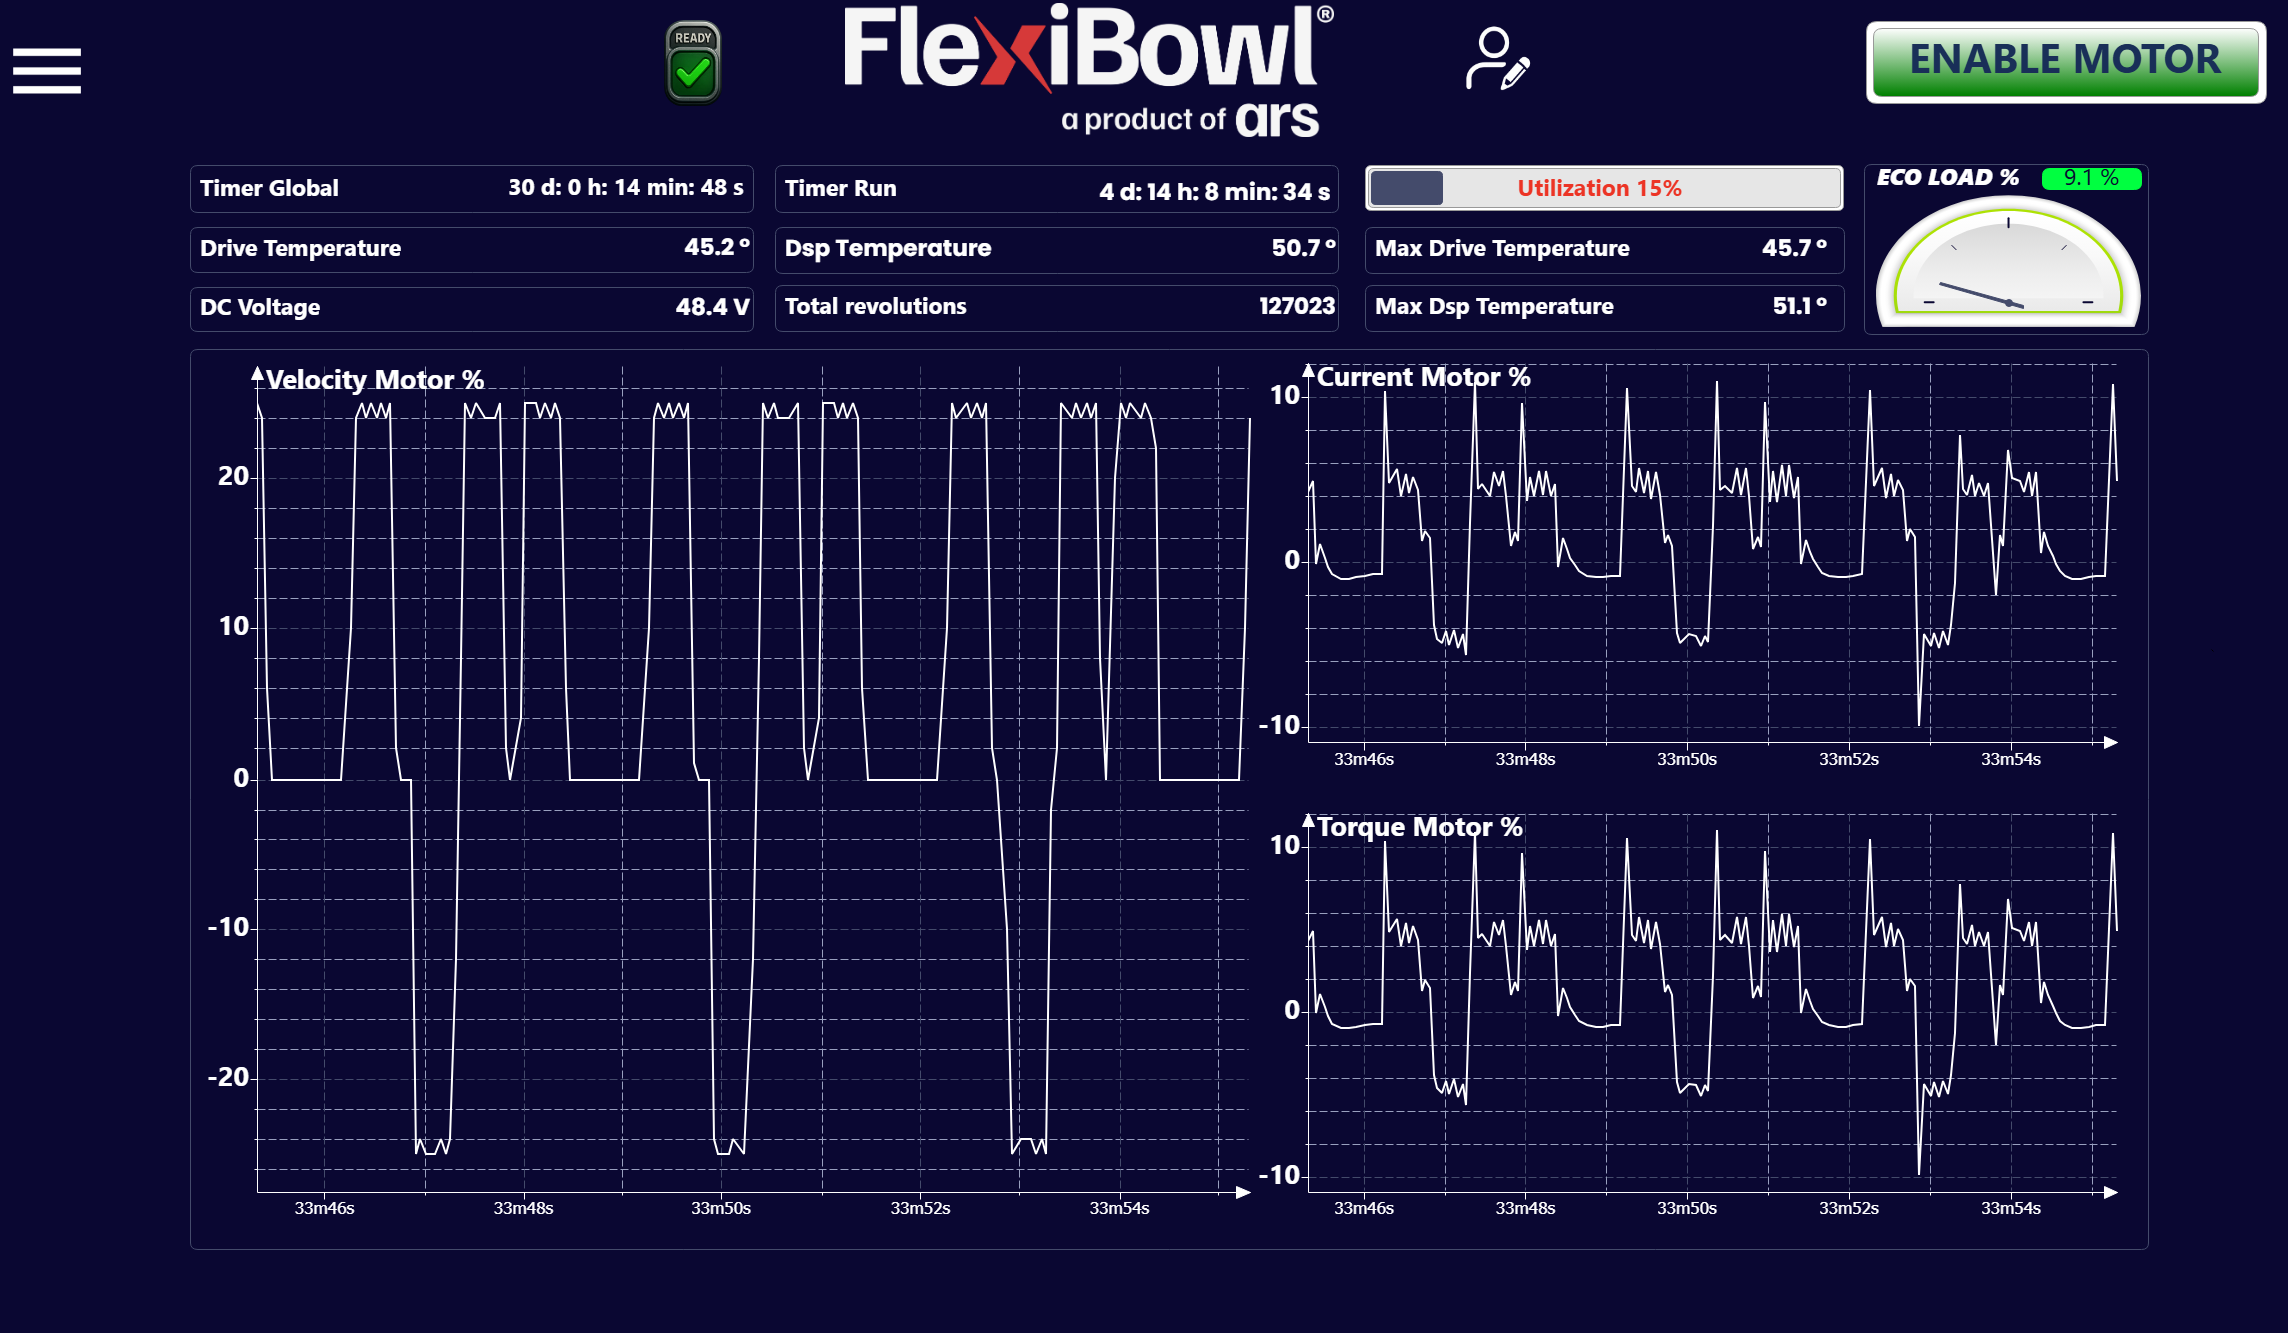
The Graphs page provides a real-time monitoring dashboard of the electrical and thermal quantities of the FlexiBowl® motor driver. On this page, the operator can check the performance of the system and detect any anomalies during operation.
Counters and indicators bar#
The upper part of the page collects the main status parameters of the system, divided into three columns.
Left column#
Field |
Example value |
Description |
|---|---|---|
Timer Global |
30 d: 0 h: 14 min: 48 s |
Total system power-on time since the last reset of the global counter |
Drive Temperature |
45.2 °C |
Current temperature of the motor driver |
DC Voltage |
48.4 V |
Voltage of the DC bus that powers the motor driver |
Center column#
Field |
Example value |
Description |
|---|---|---|
Timer Run |
4 d: 14 h: 8 min: 34 s |
Total motor running time (actual movement time) since the last reset |
Dsp Temperature |
50.7 °C |
Temperature of the DSP processor inside the driver |
Total Revolutions |
127023 |
Total number of revolutions made by the FlexiBowl® since the last counter reset |
Right column#
Field |
Example value |
Description |
|---|---|---|
Utilization |
15 % |
Current percentage of motor utilization with respect to maximum capacity. Shown by a progress bar accompanied by the percentage value in colored text |
Max Drive Temperature |
45.7 °C |
Maximum temperature reached by the motor driver since the last reset |
Max Dsp Temperature |
51.1 °C |
Maximum temperature reached by the DSP since the last reset |
ECO LOAD %#
The ECO LOAD % gauge at the top right shows the average motor load as a percentage. The value shown in the example is 9.1 %, indicating a low load — a condition typical of systems with short duty cycles or low speeds.
Tip
The ECO LOAD % value is a useful indicator for evaluating the operating efficiency of the system over time. Consistently high values may indicate mechanical overload or overly aggressive speed parameters.
Real-time graphs#
The lower part of the page shows three oscilloscope-style graphs that plot the trend over time of the motor quantities. The horizontal axis shows the time elapsed since start, in the format Xh Ym Zs (fields equal to zero, such as hours, may not be shown — e.g. 33m46s).
Velocity Motor %#
Graph of the motor speed expressed as a percentage of the maximum speed.
Axis |
Description |
|---|---|
Y |
Speed as a percentage of the maximum speed, with sign: negative values indicate counterclockwise rotation, positive values clockwise rotation. The value 0 corresponds to a stopped motor |
X |
Execution time |
Note
A negative speed value indicates counterclockwise rotation; a positive value indicates clockwise rotation. This is consistent with the Speed parameter on the Jog Motor page.
Current Motor %#
Graph of the current drawn by the motor expressed as a percentage of the maximum rated current.
Axis |
Description |
|---|---|
Y |
Current normalized as a percentage. It can take both positive and negative values depending on the operating phase (e.g. acceleration/deceleration); peaks correspond to the sharpest changes in speed |
X |
Execution time |
Tip
High, recurring current peaks may indicate overly aggressive acceleration ramps. In that case, increase the Acceleration and Deceleration values to spread the effort over a longer time interval.
Torque Motor %#
Graph of the torque delivered by the motor expressed as a percentage of the maximum rated torque.
Axis |
Description |
|---|---|
Y |
Torque normalized as a percentage. As with the current, it can take both positive and negative values depending on the movement phase |
X |
Execution time |
Note
The Current Motor % and Torque Motor % graphs typically show a very similar trend, because in a DC motor the torque is directly proportional to the current. Significant differences between the two may indicate anomalies in the driver.
Usage notes#
Warning
Consistent Drive Temperature or Dsp Temperature values above 70 °C can reduce the service life of the driver and cause thermal protection shutdowns. Check the ventilation conditions of the cabinet and the duty cycle of the system.
Warning
A DC Voltage value outside the nominal range (typically 48 V ± 10%) may indicate problems with the power supply. Stop operation and contact technical support.